
On this page
- First, be sure what you're looking at
- Shape one: a fast drop, then flat
- Shape two: falling all the way, no plateau
- Shape three: down, then up again
- Shape four: one batch of cohorts stands out
- Two common misreadings
- Treating empty cells as zero
- Watching only one number
- The prerequisite: recognising the same person
- FAQ
- What is a good retention rate?
- Should I read retention daily or weekly?
- Why are the newest cohorts' later cells empty?
Retention is one of the few metrics that answers "is this product actually useful?" directly. If new users arrive and leave, growth is like pouring water into a leaking bucket. If they arrive and stay, every bit of acquisition spend compounds.
The table itself isn't easy to read, though. A 14 × 14 grid of percentages tends to leave people remembering one number — "day-7 retention is 18%". This post is about reading more from the shape of the curve.
First, be sure what you're looking at
"Day-7 retention" can mean three different numbers:
- Returned on day 7 — activity on that exact day.
- Returned on day 7 or later — any day from day 7 onwards; this curve only goes down.
- Week 1, weekly — any activity between days 7 and 13.
Before comparing numbers with anyone, check you mean the same one. This post uses the first, daily, over 30 days.
Also: the start event changes the whole curve. Starting from "any activity" includes visitors who only looked around, so the curve sits low. Starting from "completed sign-up" or "completed the first core action" looks at people who actually began using the product. We suggest at least looking at the latter.
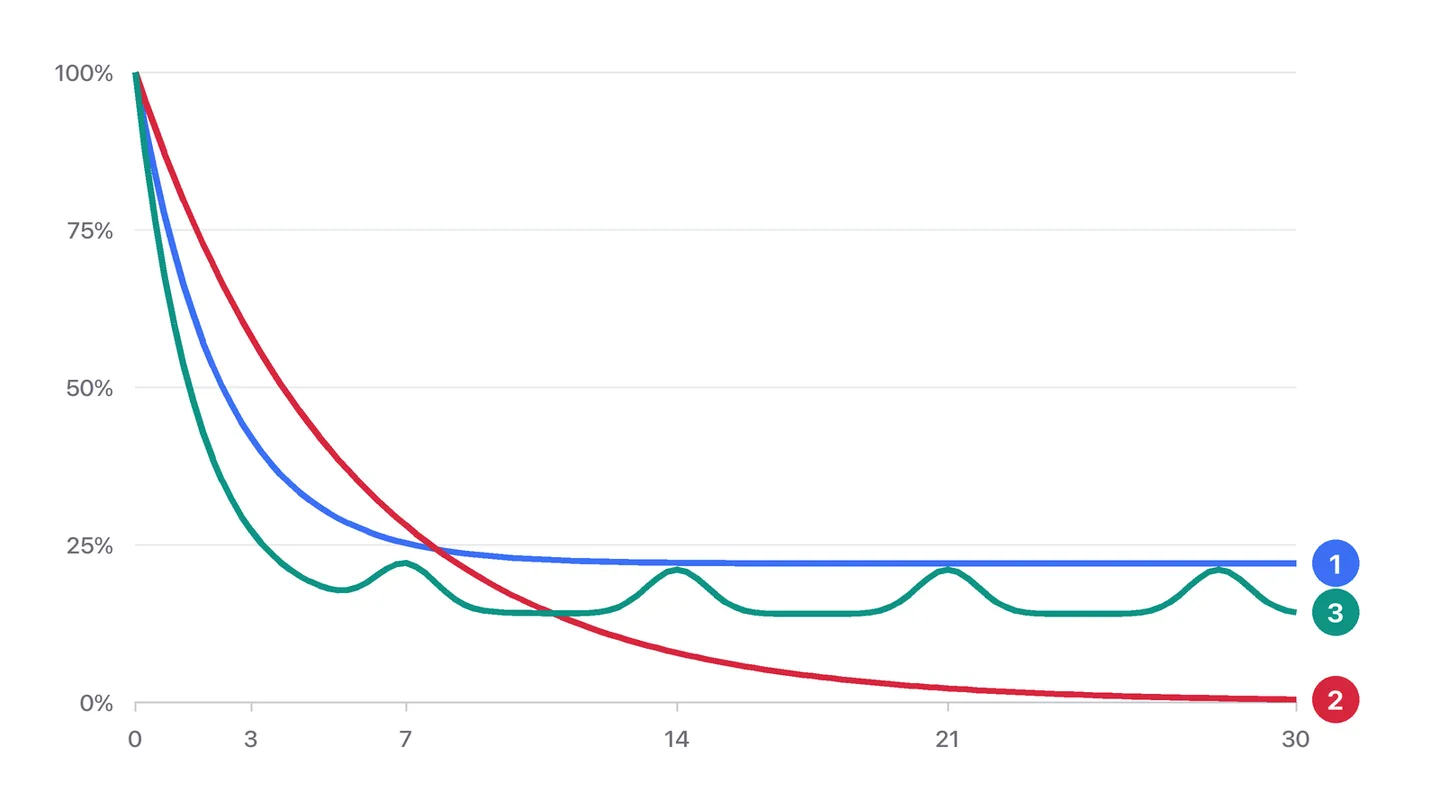
Shape one: a fast drop, then flat
This is the healthy shape. The people lost in the first days tried it and found it wasn't for them, which is normal. Then the curve flattens: those who remain have found a reason to keep using it.
The height of the plateau is the number to care about most — your core-user share. To raise it, ask: what did the people who stayed do differently in their first week from the people who left?
In practice: save the people still active on day 30 as one segment and those gone by day 3 as another, then compare the features they used, pages they read and actions they completed in week one. The one or two behaviours with the biggest difference are what onboarding should push.
Shape two: falling all the way, no plateau
The curve keeps going down with no sign of levelling off. Most users haven't found a reason they have to come back. Spending more on acquisition now works poorly, because the people you bring in don't stay.
The most useful question here: is there a smaller group whose curve is flat? Break retention down by channel, device and user properties. A common finding is that people from one particular channel, or users in one industry, retain far better. That group is who your product truly fits today — serve them well first.
Shape three: down, then up again
With "returned on exactly day N", the curve can rise on certain days. That's usually not a bug; the product has a cycle — a reporting tool opened for the weekly meeting, a report emailed every Monday, a monthly bill.
Products like this are better read weekly or monthly. Daily retention is jumpy because of the cycle; weekly smooths it out and reflects real habits better.
Shape four: one batch of cohorts stands out
Each row of the table is a cohort — people who started on a given day. Normally neighbouring rows look alike. When a few rows are clearly higher or lower, there's a reason:
- Lower: was there a big campaign those days that brought in poorly matched users? A buggy release?
- Higher: did onboarding change? Did a wave of word-of-mouth users arrive?
This is where date annotations earn their keep. Mark every release, campaign and onboarding change on the trend chart, read the retention table alongside them, and the cause is usually quick to find.
Two common misreadings
Treating empty cells as zero
Cohorts that started in the last few days haven't reached their later periods yet, so those cells are empty. Empty means "not known yet", not 0%. The same goes for the average line: its last few periods come from only a few older cohorts and jump around more.
Watching only one number
"Day-7 retention went from 18% to 20%" may mean the plateau rose (good news) or just that early loss slowed down while the curve still falls later (less useful). Look at the whole curve, not one point on it.
The prerequisite: recognising the same person
Retention needs the system to recognise the same person on day 1 and day 7. If your analytics is anonymous with a visitor identifier that changes daily, retention can't be calculated.
For products with sign-in, the most reliable approach is to switch on identity mode and calculate retention by signed-in user. Then the same person on a different device or network is still the same person, and the retention figure holds up.
FAQ
What is a good retention rate?
There is no single number that fits every product. A tool used every day, a product billed monthly and a one-off purchase settle at very different levels, and the start event you pick moves the whole curve as well. Compare the height of your own plateau over time and between segments rather than against an outside benchmark.
Should I read retention daily or weekly?
Daily suits products people are meant to use every day. If the product has a natural cycle — a weekly report, a monthly bill — read it weekly or monthly; otherwise the cycle shows up as noise (shape three above).
Why are the newest cohorts' later cells empty?
Those people haven't reached that day yet. An empty cell means "not known yet", not 0%, so leave the most recent cohorts out when you compare later periods.
Related articles

Product analytics5 min read
Building your first funnel: a sign-up flow, step by step
Many teams' first funnel has a dozen steps and shows nothing. Using a SaaS sign-up flow, here's how to pick steps, set the window, and what to do once you've found the problem.
Read article
Product notes3 min read
Why bot traffic gets its own report
By default we take identified bots out of your human reports rather than dropping them or mixing them in. The three reasons behind that, and what it means for your numbers.
Read article
Playbooks5 min read
Checkout drop-off: a seven-step investigation from data to fix
Plenty of add-to-carts, not many payments. A checklist to work through in order — rule out technical problems first, then find which step, which visitors and what cause.
Read articleSee it on your own data
Install the snippet in five minutes and get your first report today.